Charting the Skies
Our sky is constantly changing, indicating the motion of planets and stars. The study of where they're located and how they move around is called astrometry.
Humanity’s obsession to archive everything they know has existed from time immemorial. When it comes to the skies, humanity has been making star catalogs dating back to 190 BCE. The birth of astrometry as a science dates back to this era. Astrometry, put very simply, deals with the kinematics of celestial bodies. The Greeks played a large role in ancient astrometry. Their catalogs listed out coordinates and motions of some of the brighter objects in the sky. One of the oldest catalogs dates back to Timocharis and Aristillus, which Hipparchus used to determine that the Earth was not just spinning but also precessing. Hipparchus went ahead and cataloged around 800 stars, to which his successor, Ptolemy, added more and published a very accurate list in his treatise, the Almagest.
 |
|---|
| Ptolemy’s Amalgest1 |
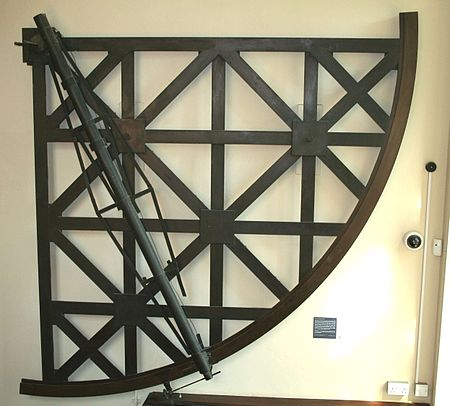
Fast forward to the next largest leap in astrometry, to the 15th century. The Danish nobleman, Tyge Ottesen Brahe, more commonly known as Tycho Brahe, was one of the best observational astronomers of this time. He made exact measurements of many objects in the sky, all of which he meticulously listed. This is even more stunning when you consider telescopes have still not been invented. Tycho Brahe was the last great astronomer to work without a telescope. He did, however, use a rather quaint instrument called a mural quadrant. It is essentially a large half protractor, which enabled him to mark out positions of celestial objects very accuratelys. On the one hand, you have all this brilliant data. On the other, you have this very jealous apprentice who was thirsty for more. He felt his advance in society was being blocked by this powerful nobleman. A dose of mercury in his banquet supper and Brahe was no more. Kepler took all of Brahe’s data and proposed the famous laws of planetary motion.
 |
|---|
| A Mural Quadrant1 |
Let’s take a short interlude and discuss how we mark out positions in the sky. From our position on Earth, regardless of your exact position, we can see a hemisphere of the sky. Combined with the hemisphere on the opposite position on the Earth, we have the celestial sphere. Immediately, this suggests a coordinate system to chart out the skies. We can modify the spherical coordinate system to fit our needs. We call this the equatorial coordinate system. We can not fix an axis, because as we previously saw, the Earth precesses. So we take a standard date, known as an epoch, to set the axis’s position at that date. We are currently in the J2000.0 epoch. After fixing a reference axis, it is straightforward to mark out objects. The right ascension is the celestial equivalent of geographical longitude, while the declination is the equivalent of geographical latitude. The GIF below shows how it works.
 |
|---|
| An explanation for Right Ascension and Declination1 |
Close to the turn of the 16th century, Hans Lippershey submitted a patent for a device that can be used “for seeing things far away as if they were nearby”. And it was this device that continues to be used to date, known as the telescope. Ratified in design by Galileo Galilei, Sir Issac Newton, and Laurent Cassegrain, this is the instrument that revolutionized observational astronomy. And it was not just the visible spectrum. When other types of electromagnetic radiation were discovered, it didn’t take too long to see that there were extraterrestrial sources of these radiation as well. Soon came a range of telescopes covering the entire spectrum, from the lengths of the radio and infrared all the way to X-ray and even gamma ray telescopes.
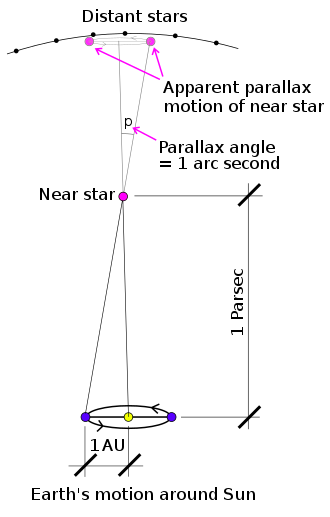
Let’s take another interlude to explain the concept of parallax. Parallax is the difference in the apparent position of an object viewed along two different lines of sight. A quick demonstration is when you close either eye and notice that the images are different. Different orbital positions of the Earth cause some confusion in measurements, but it can very simply be resolved when you factor in parallax. Parallax is so vital to our understanding of the motion of objects in the sky; we often take measurements of celestial objects when we are at opposite ends of the Earth’s orbit to determine the body’s distance along with its position.
 |
|---|
| An intuition for Parallax1 |
Parallax measurements were tough before you made this leap in understanding. And indeed, the first attempt to measure stellar parallaxes in 1729 by James Bradley failed. He did discover two important things - that the Earth rotates in the other Euler angle as well - so it nutates in addition to precession and spin. The other was that telescopes suffer from aberration, and corrections will need to be made to observations to account for this. In 1807, Friedrich Bessel refined Bradley’s catalog of around 3000 stars and made the first successful measurement of stellar parallax.
By the end of the 19th century, humanity only knew 60 stellar parallaxes because of the difficulty to measure them. Photographic plates helped us make the next leap, and in the early 20th century, we had astrographs, which essentially gave us pictures of the sky. With the rapid advancement in technology, we had computers on the job as well. The project Carte du Ciel (French for Sky’s card) helped make a pipeline of sorts for how sky mapping could be done. This opened the floodgates, made astrometry much less expensive, and opened the field to everyone.
In 1968, observations of the sky left our planet for the first time, with NASA’s OAO-2. The Soviets launched the Salyut missions soon after. In 1989, astrometrical missions took the skies with ESA’s Hipparchus satellite being launched to orbit, with the sole purpose of improving our catalogs. During its four year run, it measured the properties of over a hundred thousand stars. Recognizing the need to have an accurate measure of even more objects, the ESA sent another satellite, the Gaia mission, in 2013. It improved on the precision of Hipparchus by a magnitude of 100 and cataloged a billion stars. We now have numerous satellites looking around in the sky, looking to measure everything we can see to expand our understanding.